
What do you geek out over?
We all have something we geek out over, something we could spend hours looking at or studying. Maybe for you it is house colors, baseball statistics, the next way you might design your garden. For me, I regularly have what I call nerd nights where I pick a city and look at the Sanborn Fire Insurance maps. Sanborn maps are probably my favorite historic resource to consult and for this blog post, I am going to share why I get so excited when I find Sanborn maps.
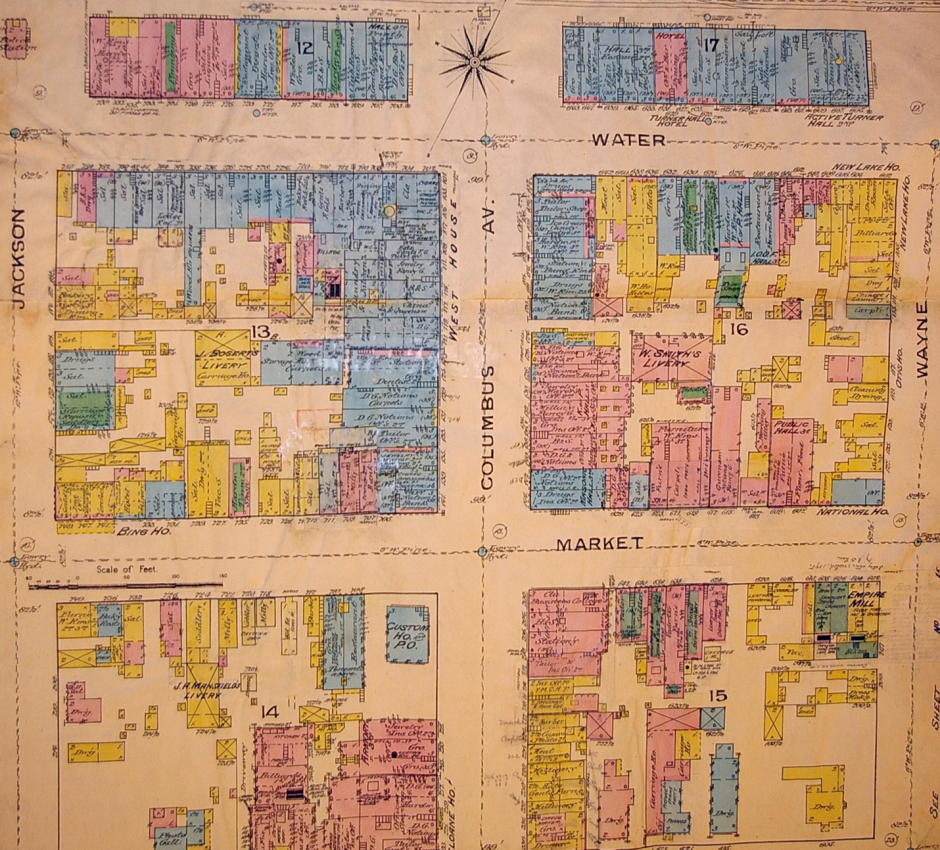
A Sanborn Fire Insurance Map from Sandusky
Sanborn maps were created as a risk analysis tool for insurance underwriters. The maps were produced from 1866 through 1970. Population growth, demographic shifts, and urban sprawl all necessitated the need for regularly updated maps. A new map was created approximately every 10 years. The maps were created for towns and cities, but are generally not available for country properties. For the bigger cities, like Columbus or Cleveland, multiple volumes were needed to show the entire city. New York City reportedly has 39 volumes.
What’s so special about these maps? The wealth of detail and information which can be gained about a building for which there are no photographs can often be found in these maps. Each map was created on a piece of paper measuring 21” x 25” and was drawn at a scale of 50 feet to 1 inch. Everything was measured by tapeline, including the buildings, streets, sidewalks, and other utility features like distance to fire hydrants, gas lines, and water lines. The last part was particularly important for the fire insurance aspect of the maps. While the maps were created across the country, all maps are set up the same; all keyed the same, and demonstrate the same level of detail. Each volume was set up in the following order: a decorative title page, index of streets and “specials” which included schools, churches, and bigger businesses, a master key for the map (a map of the entire city color coded and numbered showing which map you would need to look up for your particular address), and some general information on population, geography, geology, economy, etc. In the case where multiple volumes were needed for a city, the master map would also let you know the volume number you needed if the area was adjoining the map you were currently using. Many states, including Ohio, have indexed digitized copies of the maps. If you have a library card, you can access this database (yes, even from your home in your comfy clothes). Here’s the link http://sanborn.ohioweblibrary.org.oh0057.oplin.org/ unfortunately, most of the digitized maps are black and white, but a lot of information can still be gained.
For this example, we will look at Heritage Ohio’s location. If you’ve never been to our office, feel free to do a quick Google maps street view search so you can get a 2014 idea of what the neighborhood looks like today. Our address is 846 East Main Street, Columbus. Click on the sanborn.ohioweblibrary link from above and type in Columbus on the search box. Now we have a list of the maps which have been digitized for the city. Notice that the first two years only have a single volume, then in 1901 there are 3 volumes, 1921 there are 6, and then in 1951 there are 9 volumes.
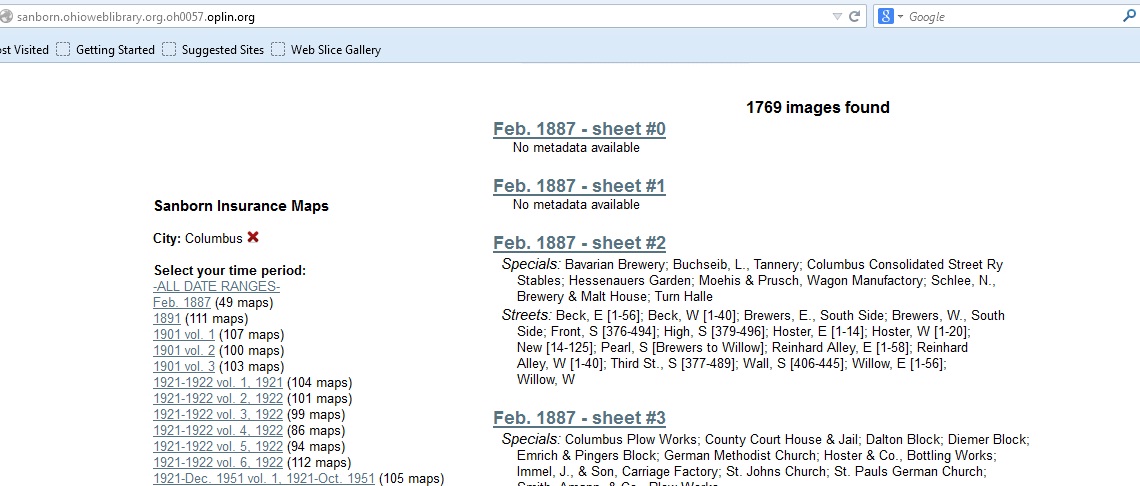
Go ahead and click on 1887. This will bring up a hyperlink for each map and also lists the “specials” and the streets (including the street numbers represented on that map). We want the street titled, Main, E which includes 846.
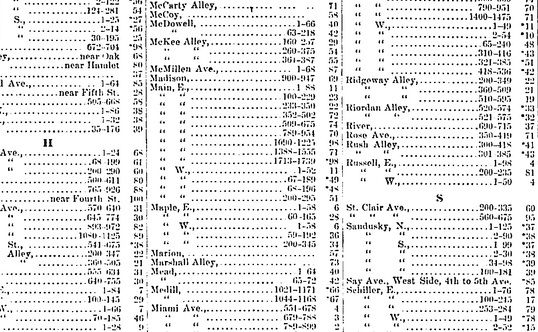
One of the first pages (usually page 0a or something similar) will always be the index, which if there were multiple volumes for the map would let us know if we were in the correct volume. In this case, the index is the first link. Clicking on the link, we find that there was a gap in the mapping between 824 and 893 East Main Street. Rather irksome knowing they cut off right where you need the map! So, click the red ‘x’ next to the Date: Feb, 1887 on the left side of the screen and it will bring you back to the list of maps.
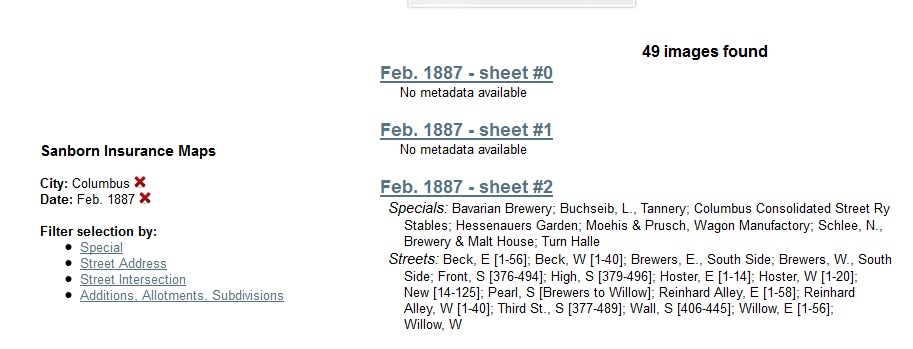
Let’s try 1891. The index tells us that we need sheet number 70. On the right side of the screen, you can “jump to” a specific page. Go ahead and type in 70 and check it out. You should be able to zoom in to read the tiny details. If you had a chance to drive by our office or street viewed the neighborhood, you would know there is a square block of nothingness across the street from us. However, now you know what used to be there….an orphan asylum, and a large campus at that! The next map available is from 1901. I’ll save you the time and let you know you that our address is in Volume 3, sheet 320. Compared to the last map, we can see there has been a lot of development on our block. Our building is at the bottom of the sheet, where 844 and 848 are labeled. Yes, the one with the attached bowling alley. Focusing on this parcel of land, this map shows us that the building was 2 stories, with an opening to get between 844 and 848 in the middle, as well as access to the bowling alley. Keep going and find out what else became of the block. What became of the orphan asylum?
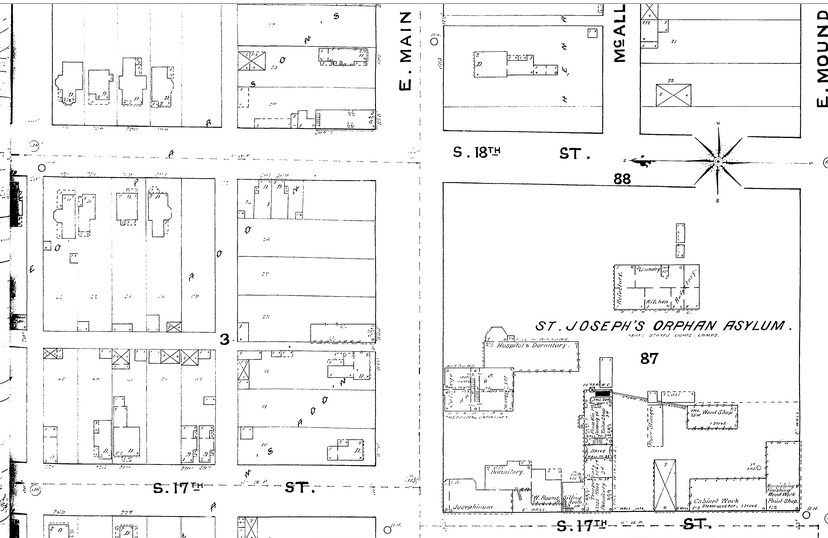
Sanborn Fire Insurance Map, 1891
The color coded maps, in my opinion, are well worth the trip to the library or historical society. Here are the links for the keys so you can decipher the map. For the black and white maps, like the digitized maps mentioned in this blog, use this key: http://sanborn.umi.com/HelpFiles/bwkey.pdf
Here is a color coded key: http://www.loc.gov/rr/geogmap/sanborn/images/sankey22c.jpg
Here is a link for the many of the abbreviations found on the maps: http://www.newberry.org/sites/default/files/researchguide-attachments/sanbornabbrv.pdf
Tales From a Privy Shaft part 1
Passing through downtown neighborhoods, many of us will notice the historic houses. Some are still as beautiful as the day they were completed and some are diamonds in the rough. Even driving through the dilapidated areas, I’m sure many of us wonder what the neighborhoods looked like in their prime. While the buildings are beautiful, I have always been attracted to the story behind the building. The story of who lived there, what the children played with, the health concerns of the former tenants, consumerism patterns and the story of the built past can be told through archaeology. Archaeology also can present new, untold stories, as we will see play out in the excavation of one of the privy shafts in the Queensgate II excavation. Since this project has so much detail and so many stories, it was necessary to split it into 3 blog posts.
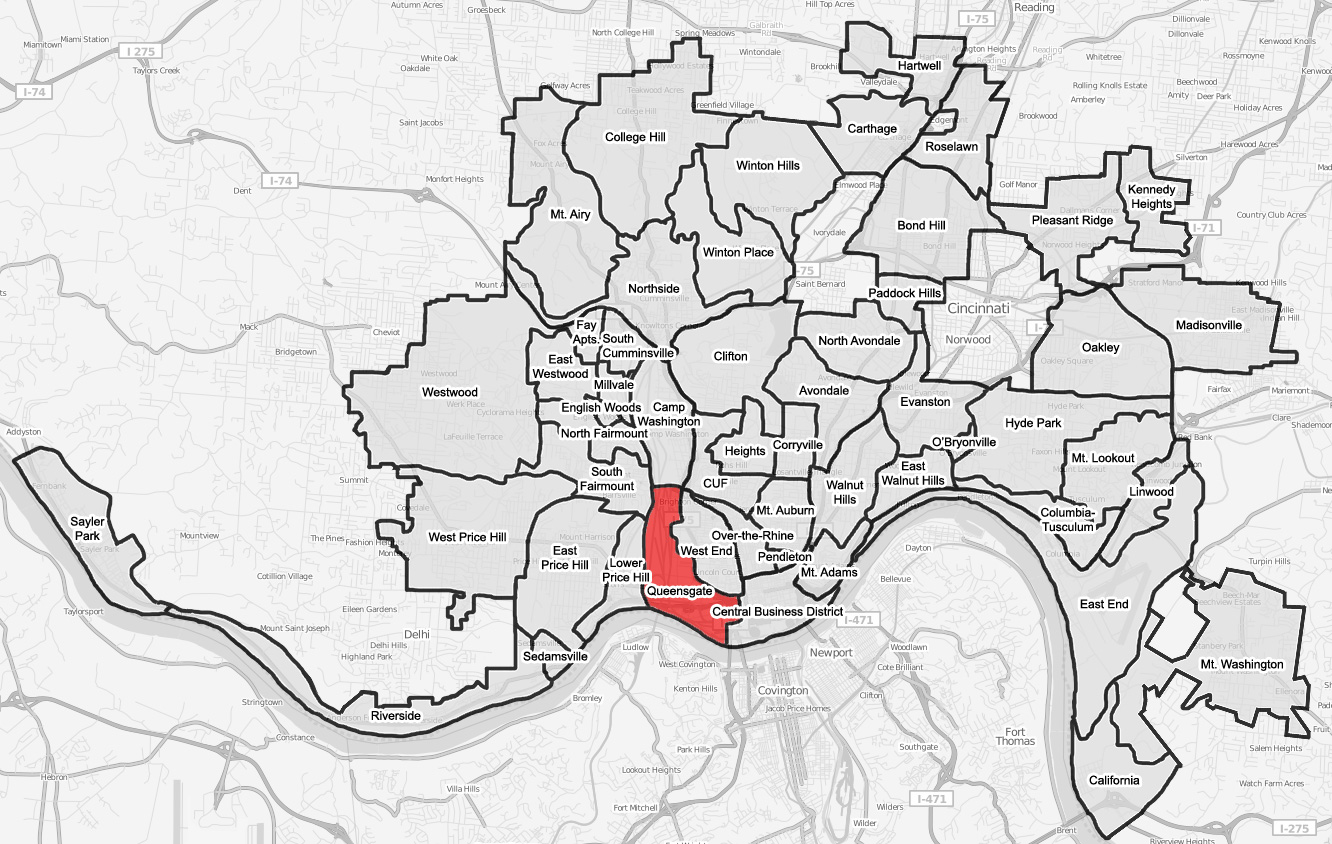
Credit: http://en.wikipedia.org/wiki/Queensgate,_Cincinnati
How the Project Began
The Queensgate II neighborhood of the 19th century was substantially different than the Queensgate II of the late 20th century. The once thriving, diverse, highly populated area, had become a memory. With urban housing projects to the north, a booming business district to the east, and a freeway to the south and west, it is no surprise that by 1968, the population of this area was a mere 1280. The Queensgate II archaeology project was born from Ted Sunderhaus’ observation that despite excessive amounts of “excavations” by looters, and the vast amount of vacant buildings, there were still several areas which could provide the archaeological features necessary for the study of this diverse 19th century neighborhood. The Miami Purchase Association (now known as the Cincinnati Preservation Association) approached the City of Cincinnati with a plan to incorporate the results from an urban archaeological study into the mitigating factors of nearby redevelopment plans. The project was restricted to properties owned by the City of Cincinnati, within a five block area. The year prior, a detailed lot-by-lot history, which shed light on the class diversity, was conducted by Stephen Gordon and Elisabeth Tuttle. The archaeological research would provide additional insight on this topic.
Neighborhood Beginnings
The area known as Queensgate II (now known as the Betts Longworth District) is a 7-block, 117 acre area of Cincinnati bounded by Ezzard Charles Dr., Race Street, 6th Street, and I-75. Streets began being laid out as early as 1815 and a building boom followed the next decade. The city’s population tripled during the 1840s, and a change from frame construction to brick construction followed. Most people in the Queensgate II neighborhood were from New Jersey, Ohio, and Pennsylvania, and were generally prosperous merchants. By 1870, however, a large German influx moved in and the original inhabitants moved away. Tensions between the Jewish population and non-Jewish population were common. In 1918, 55% of Cincinnati’s Jewish population lived in the West End (an area which includes Queensgate II). By 1930, however, only 5% remained. Also noteworthy was the increase in the black population. The 1860 census only listed 80 black people in the Seventh Ward, but by the 1920s, as much as 80% of Cincinnati’s black population lived in the West End. Demolition of Lincoln Park for Union Terminal in the 1930s, construction of the Interstate, and government housing drastically altered the streetscape.
Lot Selection
Since Queensgate II provided such a heterogeneous population, it was an ideal setting for the study. Preliminary surveys included looking through the back dirt left behind by looters, which were found to have a representative cross section of the past inhabitants with a wide array of artifacts recovered. Between the data provided from the Gordon and Tuttle report and a reconnaissance survey to identify potential features, along with factoring in economic diversity, potential for an intact feature, and the completeness of the historical record, selections for sites to be excavated was made.
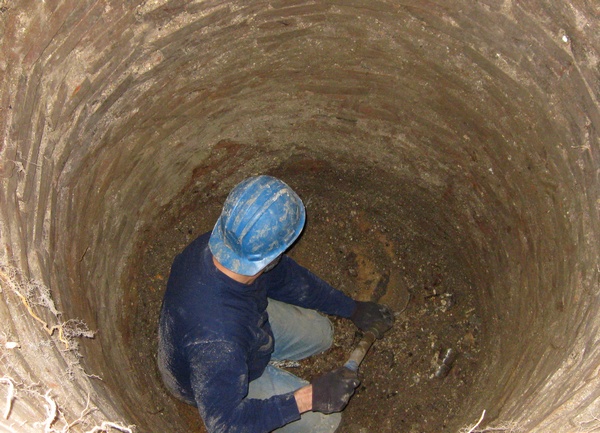
A brick-lined privy shaft being sampled in Manhattan. Credit: http://en.wikipedia.org/wiki/File:Bricklined_privy.jpg
Two lots were chosen, based on the selection criteria. The first held an 1840s frame structure and held an intact privy and cistern. Thorough documented history, including city directories which listed occupation for each resident, for this lot and the neighboring were found. The second location selected was the William Betts house. Similarly, a thorough history, intact privy and cistern were found on the lot. Additionally, it was decided that at least one builder’s trench be excavated to provide additional information.